Scenario Test Execution
Description
Scenario Test Execution is designed for testing a complete scenario. It provides a structured environment where users can execute and evaluate various scenarios to ensure they function as expected.
How to Open This Screen
From the Dashboard
- Click the Debug button on the scenario overview: This method allows users to select an existing scenario for testing.

 Figure 1: Debug Button on the Scenario Page
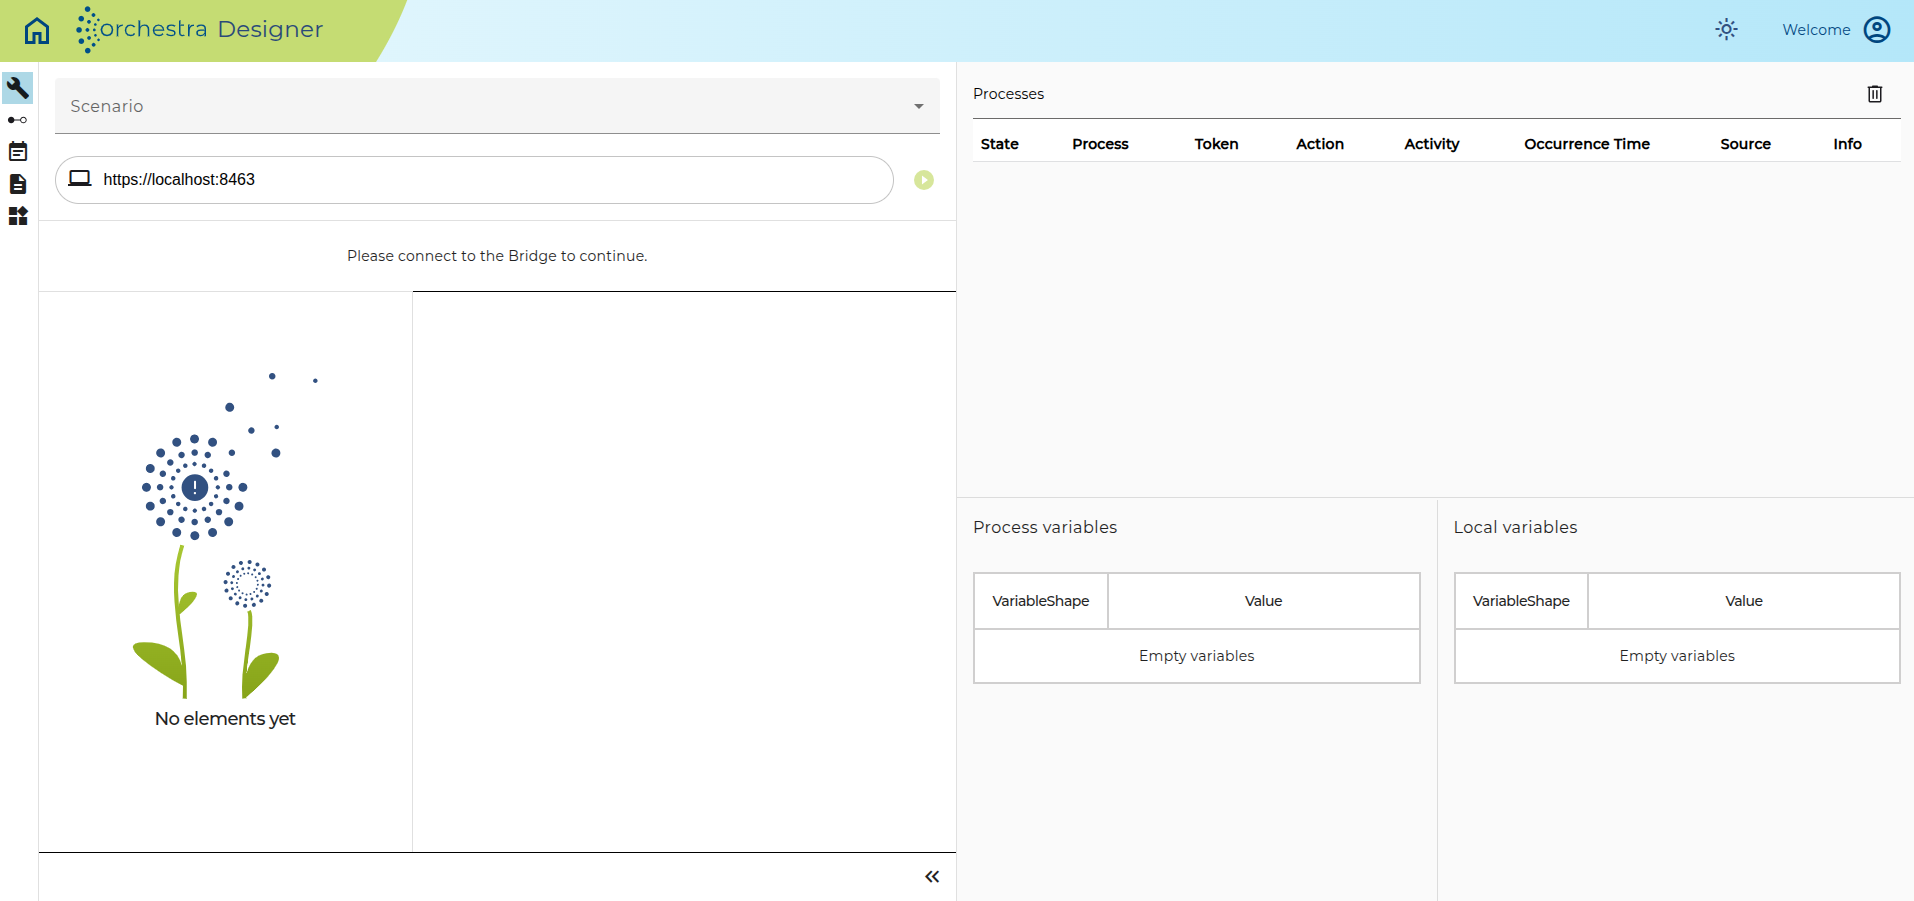
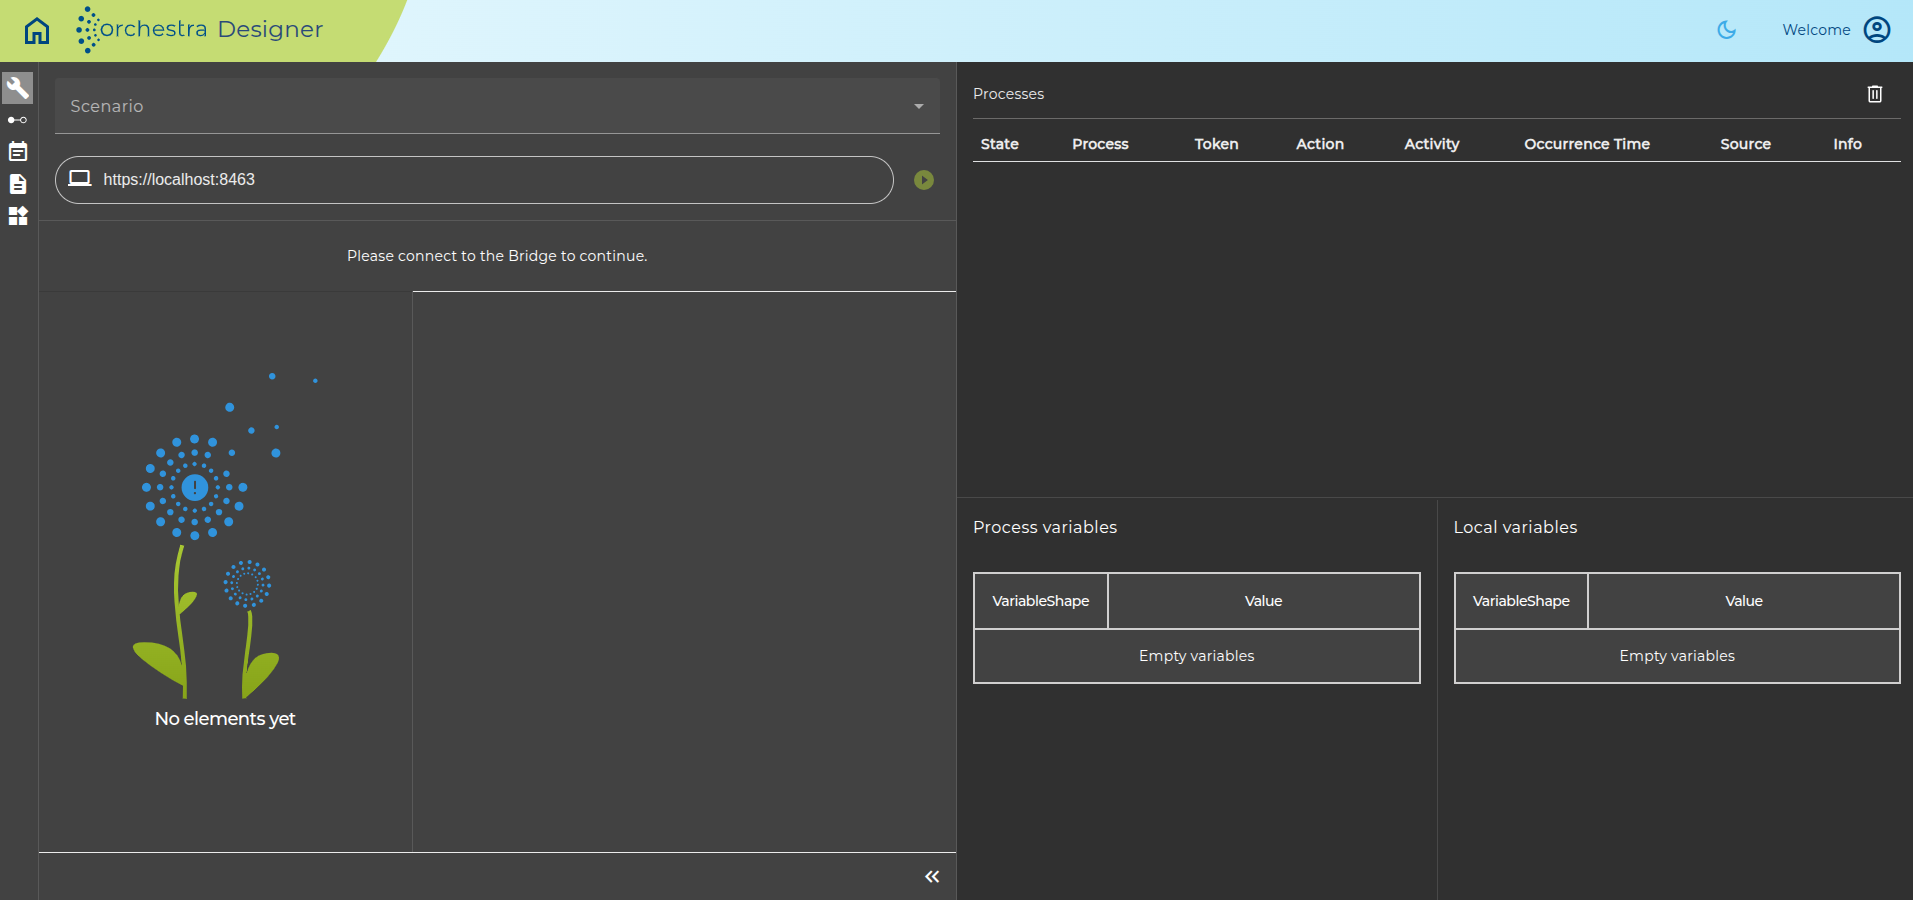 Figure 2: Scenario Test Execution Screen After Clicking the Debug Button
From the Scenario Page
- Click the Debug button on the Scenario page: This method will automatically select the scenario that corresponds to the one initiated from the Scenario page.
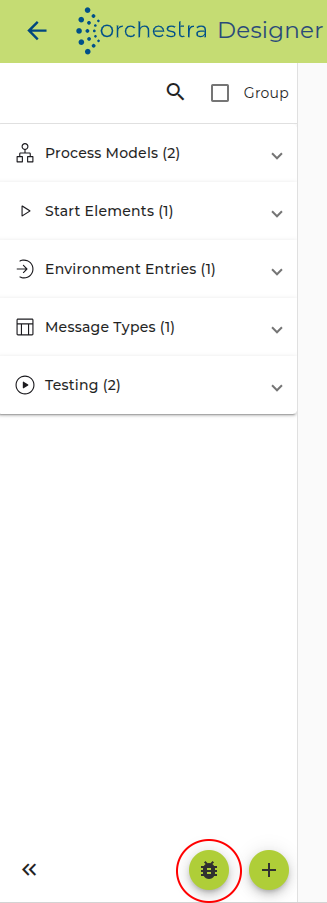
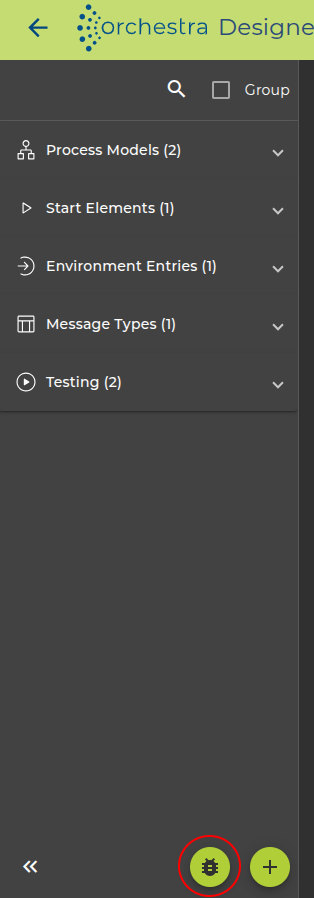
Figure 3: Debug Button on the Scenario Page
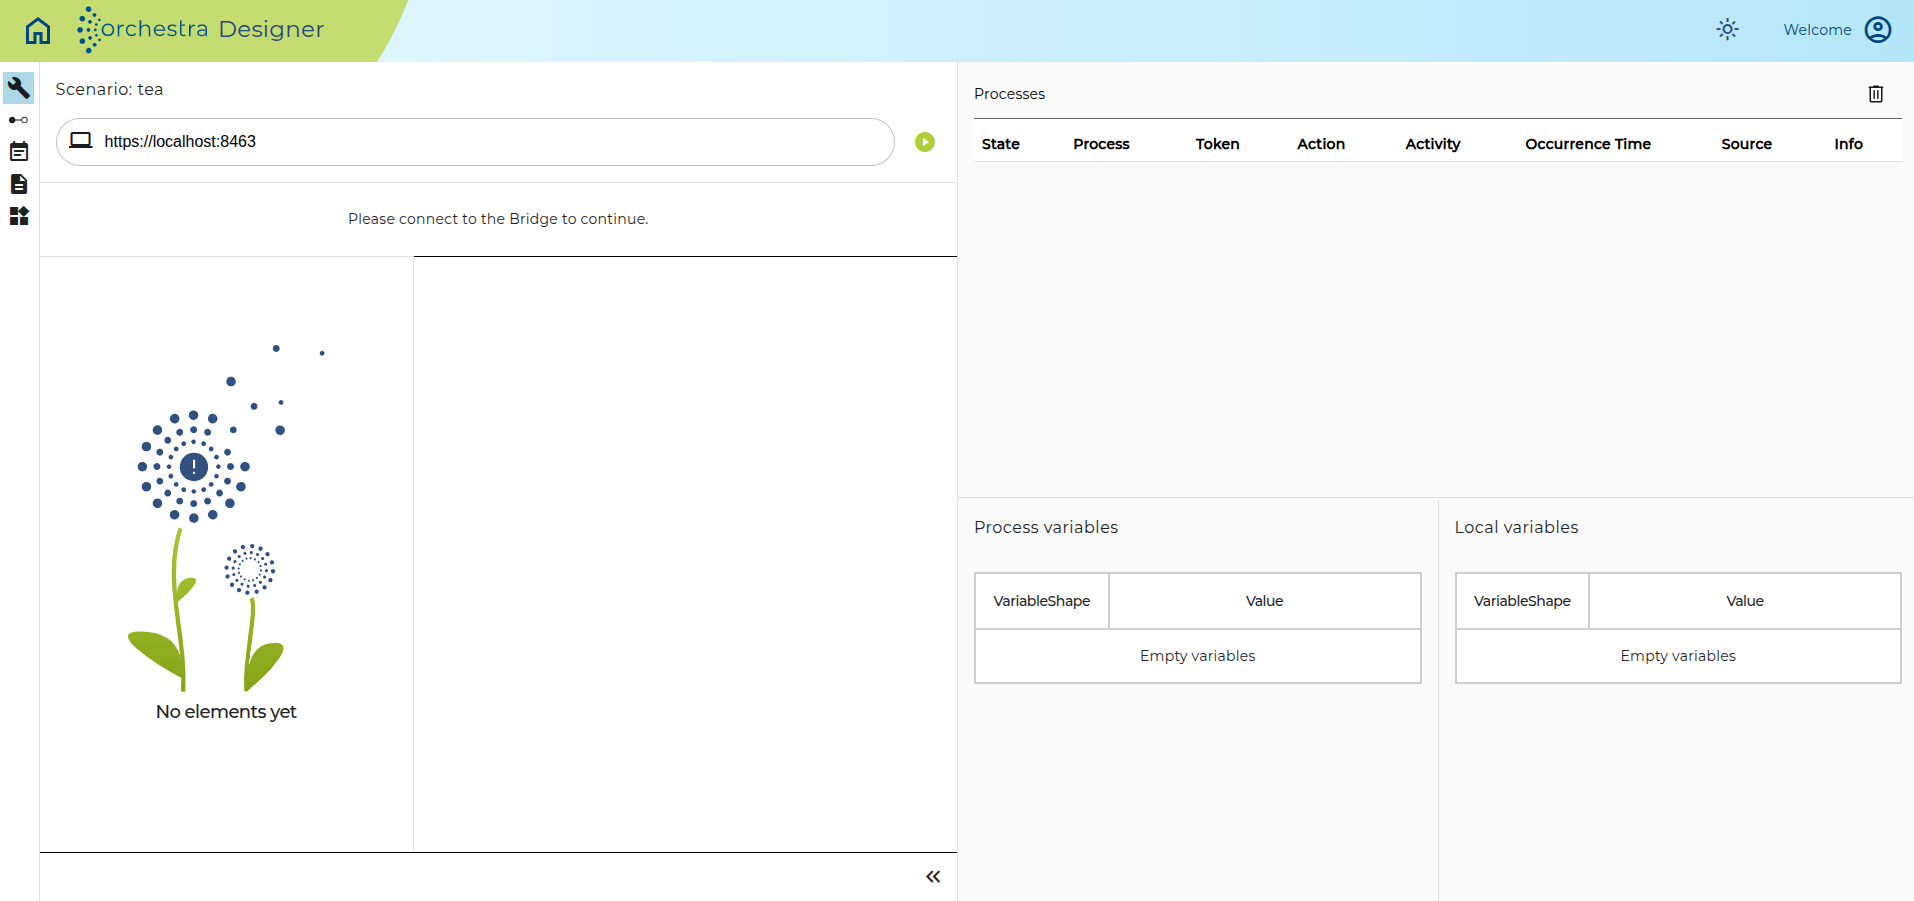
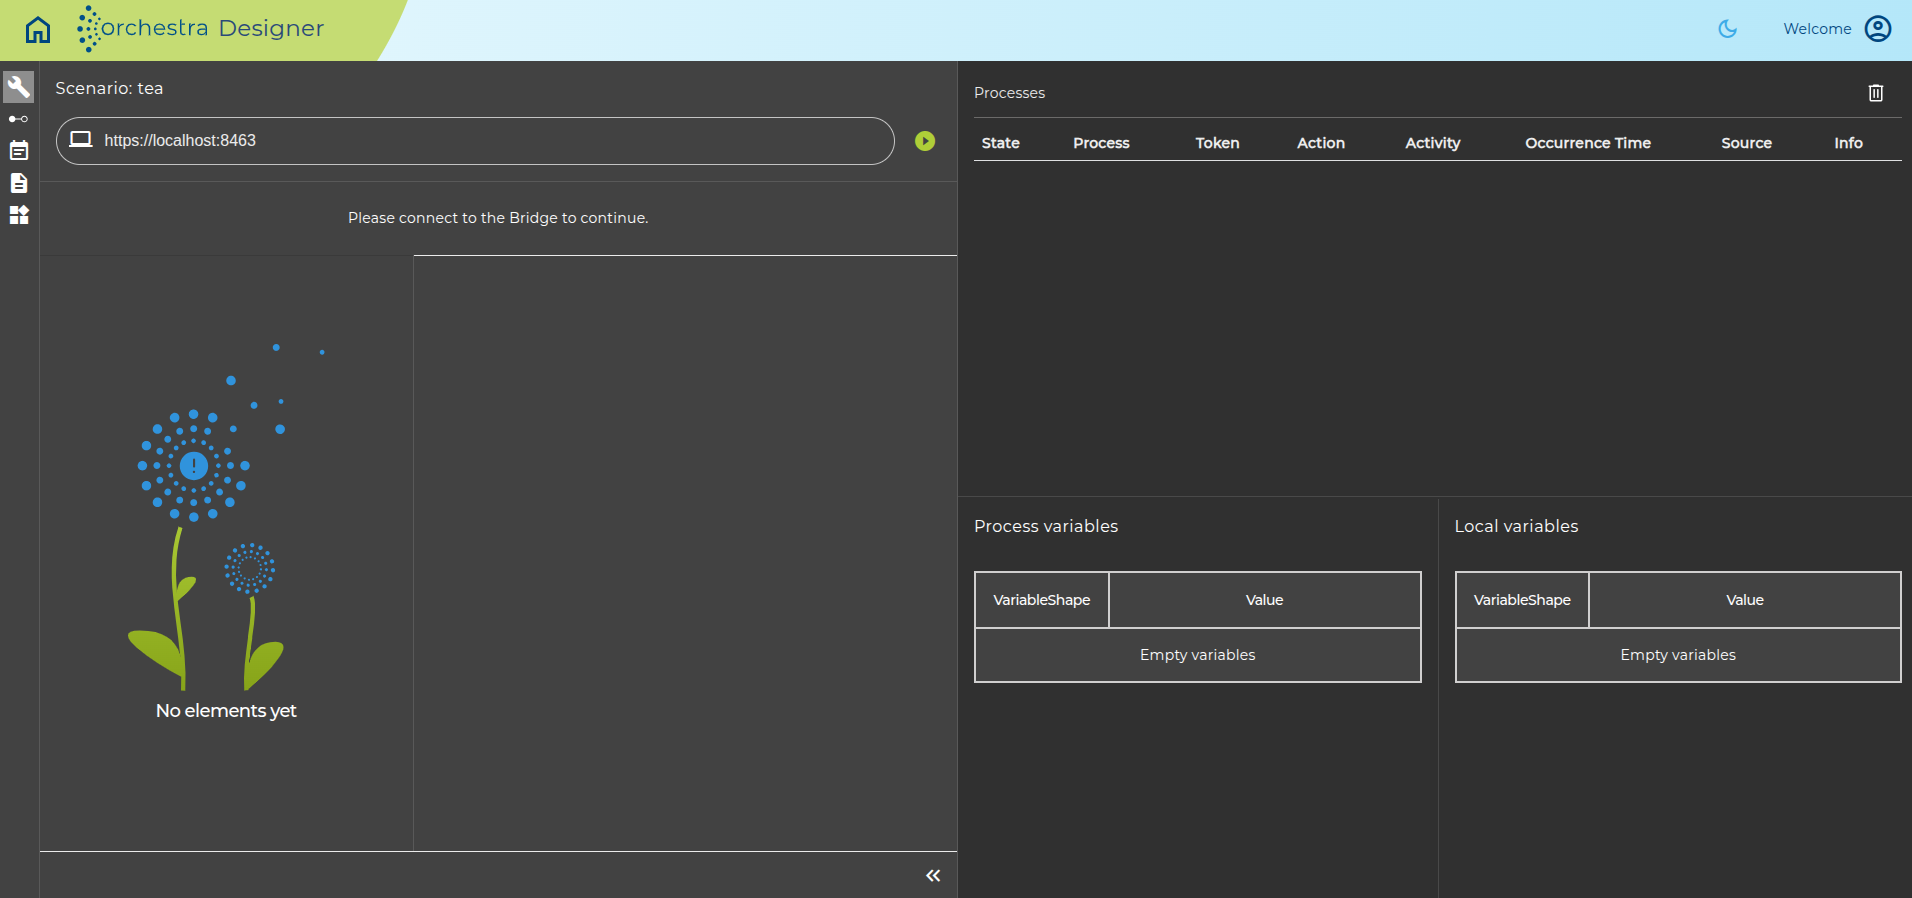
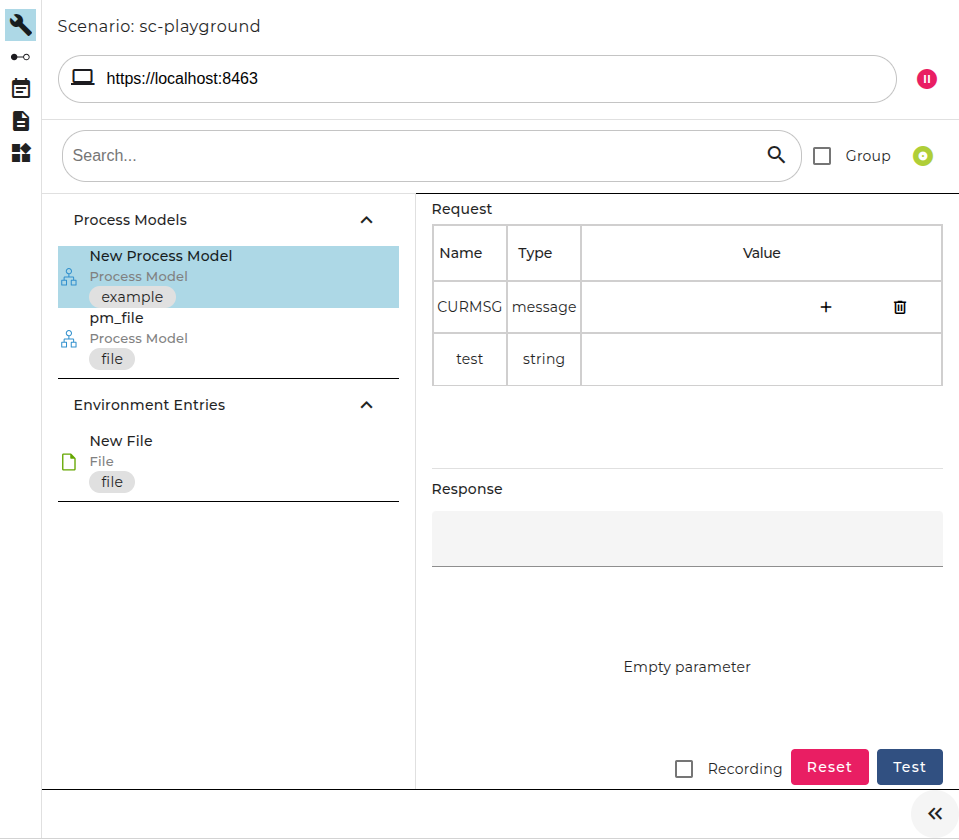
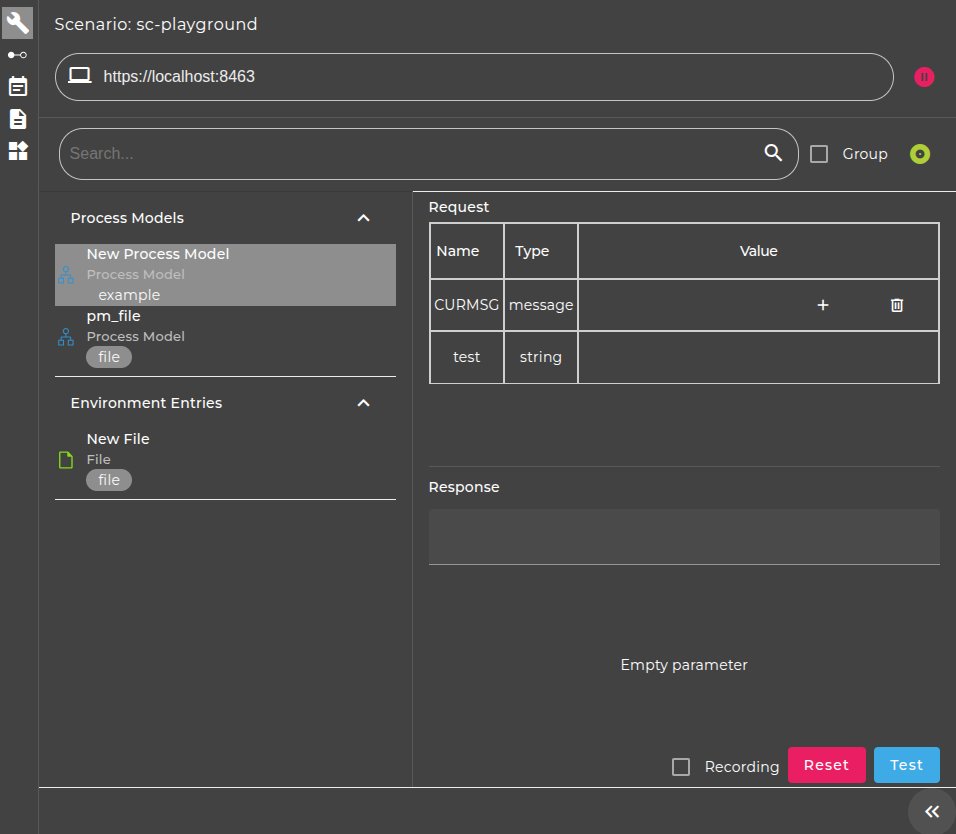
Figure 4: Scenario Test Execution Screen After Clicking the Debug Button
Navigation Sidebar
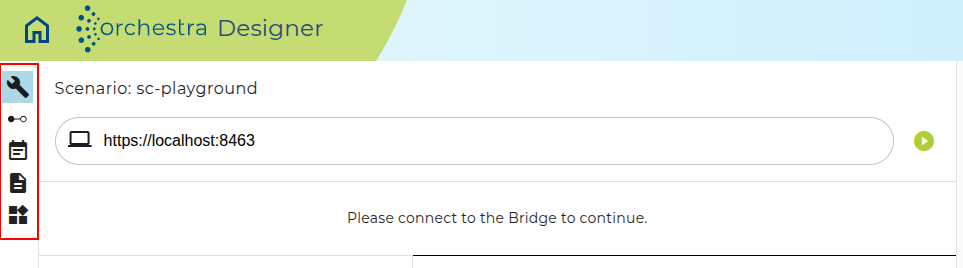
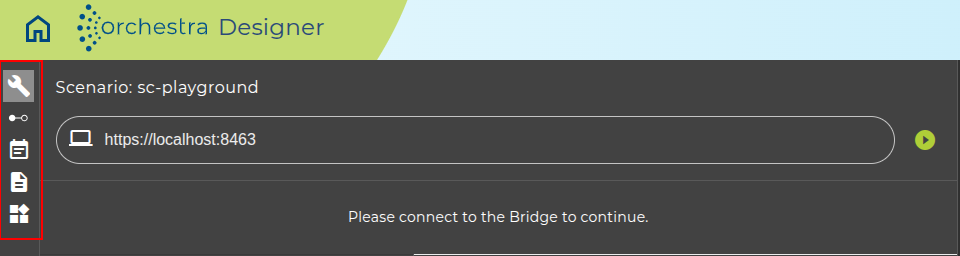
Navigation Sidebar provides access to key sections for managing and monitoring the scenario test:
-
Configuration is used to start the testing process.
- The green-circled button is used to Start/Stop the scenario test.
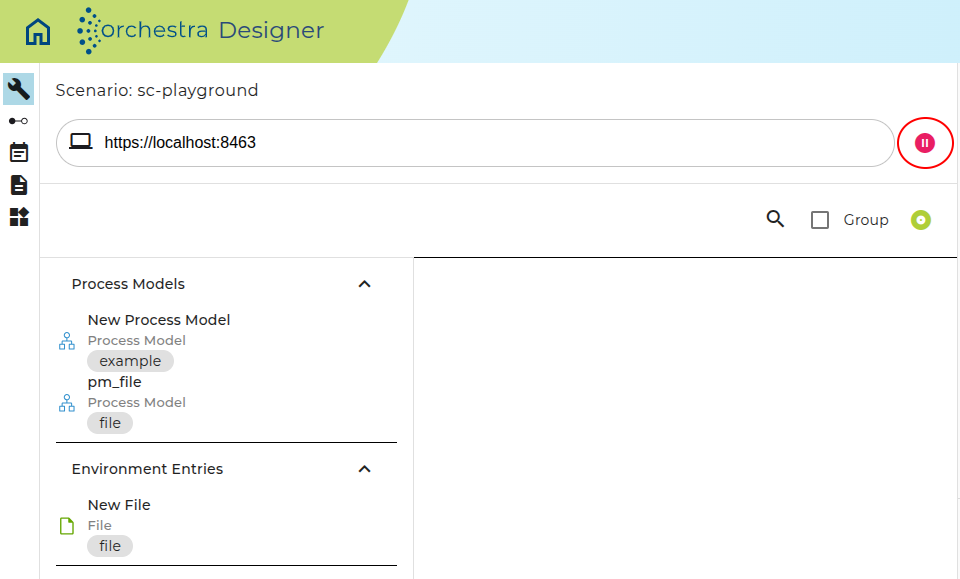
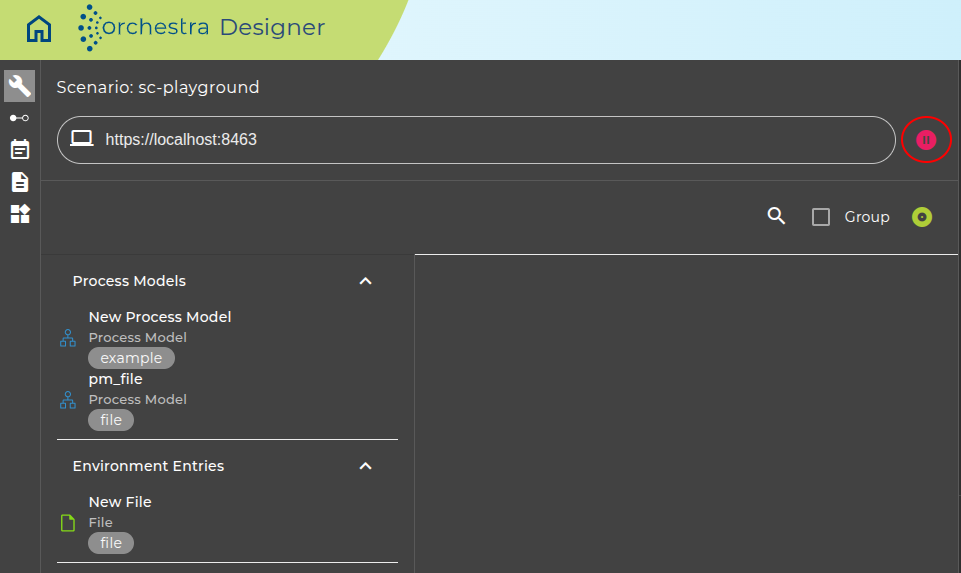
- The Search field allows users to search for scenario elements by name or label.
- The Group option changes the view of scenario elements to display them according to their labels.
- The Record option allows to record all activities of the scenario to generate Testcases.
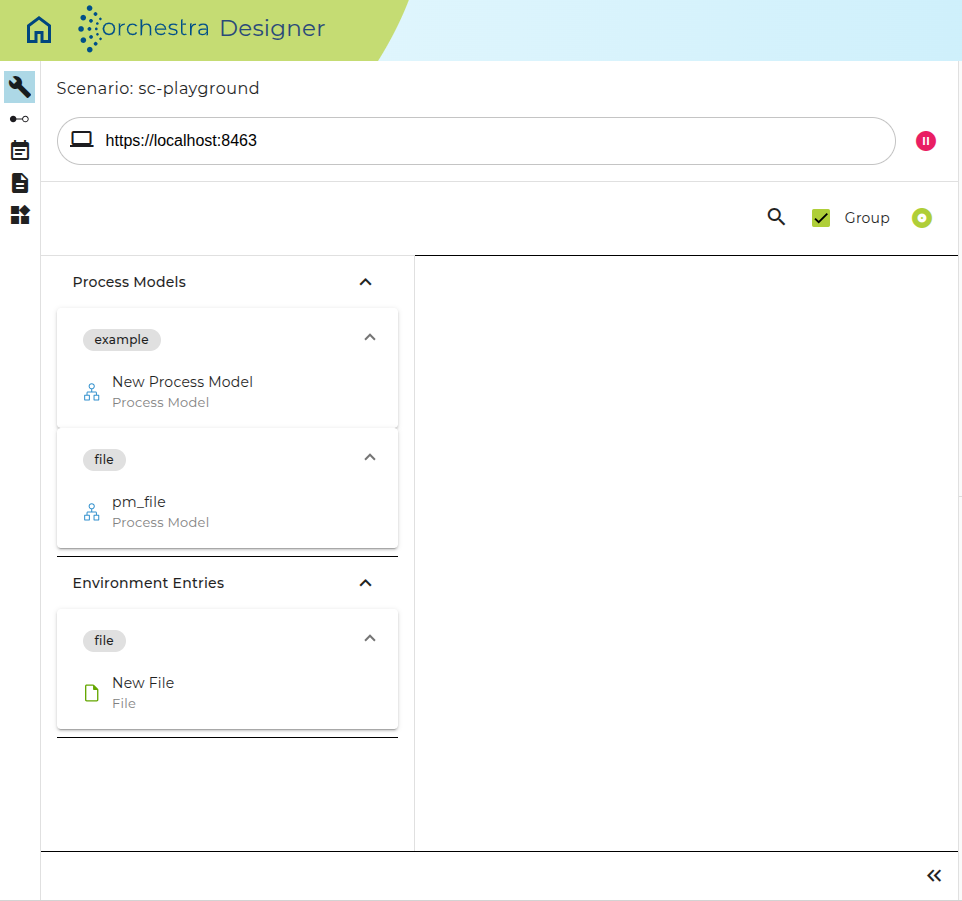
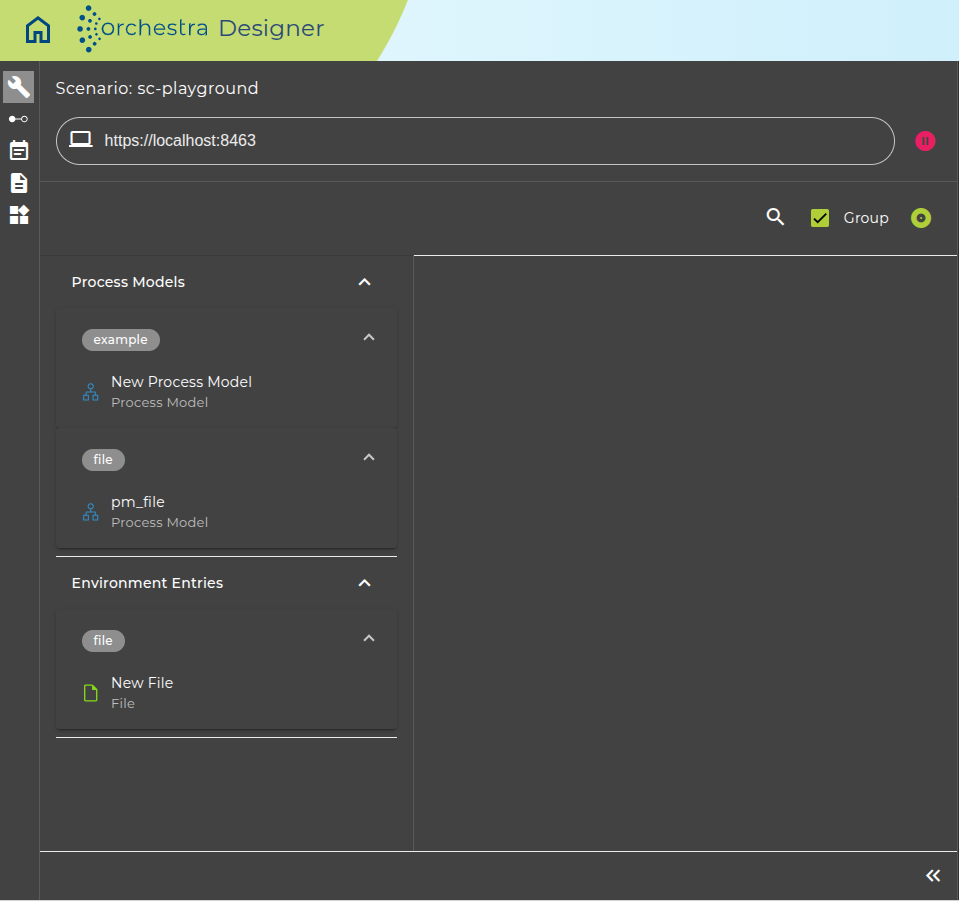
- Selecting a scenario element opens a dedicated screen for testing that element.
-
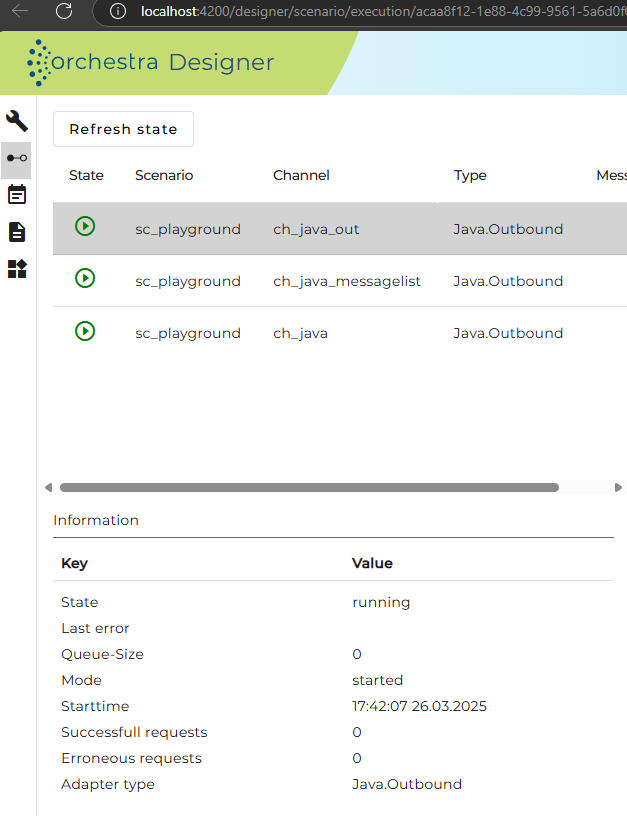
Adapter State displays all active adapters in the scenario.
-
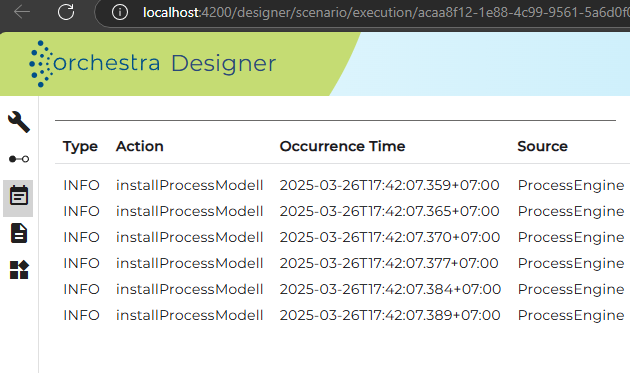
System Events provides a detailed view of System Events related to the scenario test.
-
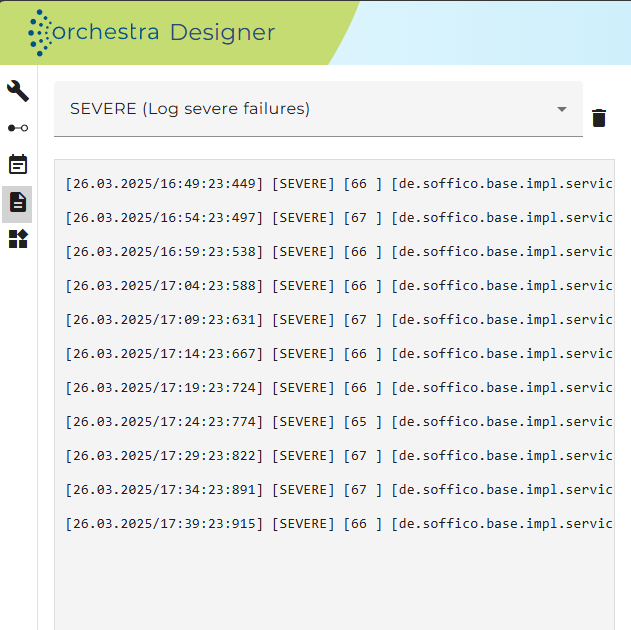
Logging displays log information generated during the test process.
-
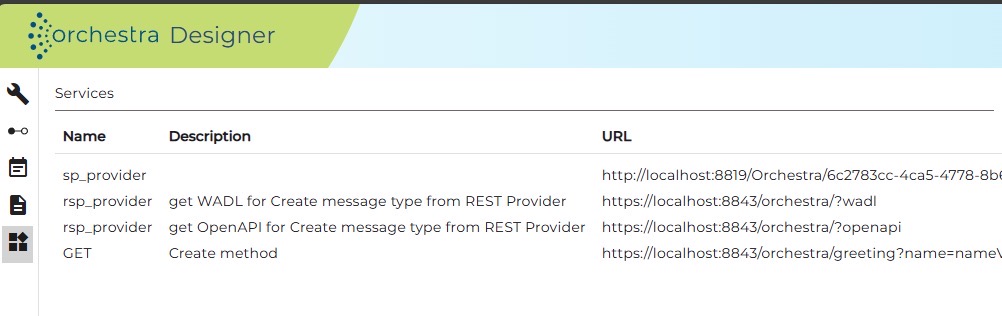
Services shows the services currently managed by the Orchestra system.
Process Monitor View
This section is for tracking process model execution and is divided into three parts:
-
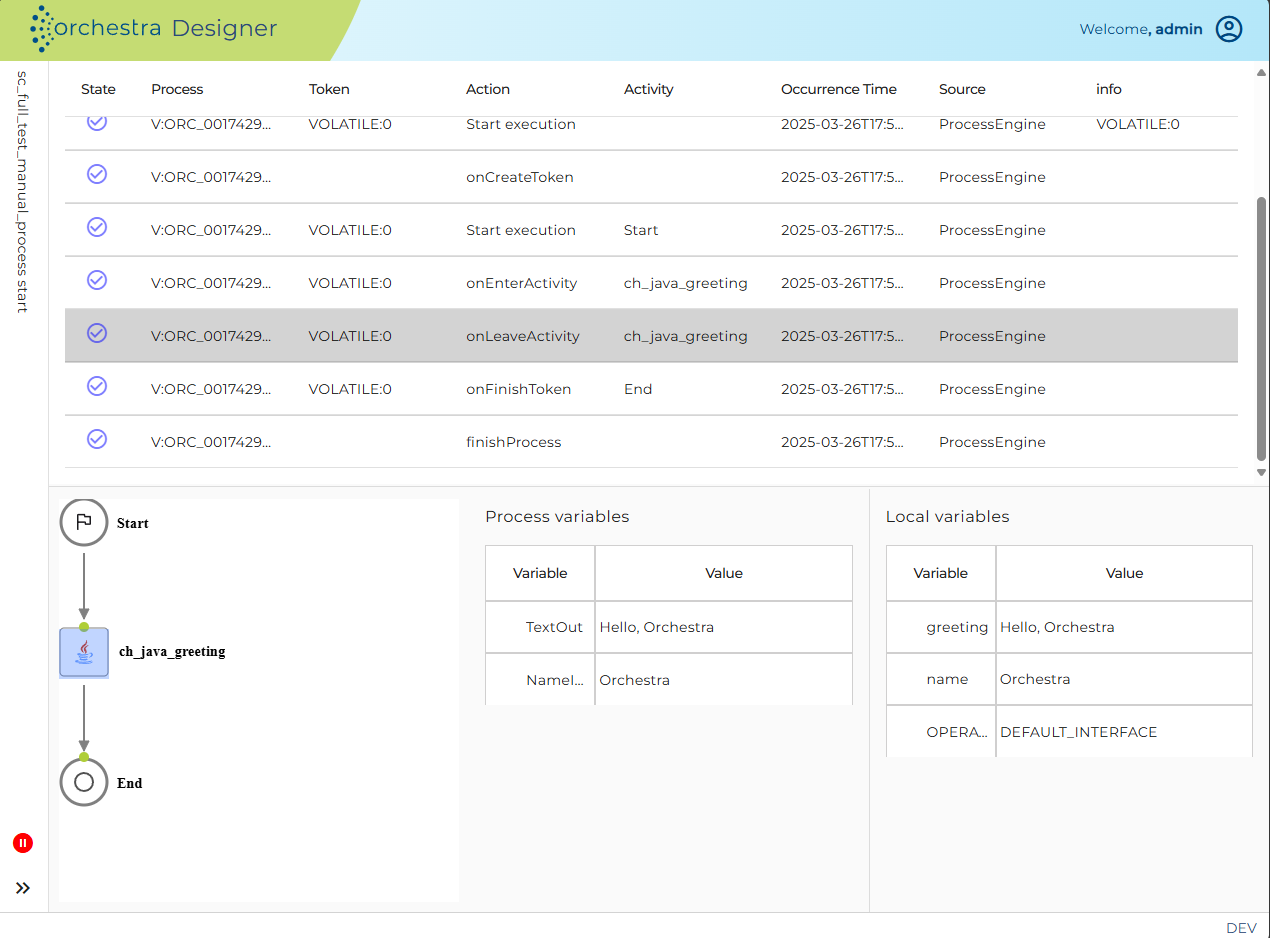
Process Event: displays events triggered by the process. Selected a row reveals the process flow image and assigned variables.
-
Process Flow Image: visualizes the process currently in progress.
-
Process Variables/Local Variables: displays variables and their values at the selected process event.