Scenario & Process Logging
You can change the log level via Orchestra Monitor inside Settings > Log Level. This change takes effect immediately.
Alternatively, you can modify the log level by editing the file located at /orchestra/WEB-INF/classes/logging.properties. Please note that a restart is necessary for changes made in this file to take effect.
Scenario Monitoring & Logging
It is possible to activate scenario-specific logging for Orchestra. Scenario-specific logging can be viewed as logging application data, although not all entries from the standard log will be automatically written to separate log files.
The logging entries in the scenario log can be created in the following ways:
- Scenario-specific system events can be additionally written to the scenario log.
- The programmer can write log entries using the standard Java logging mechanism (EmdsLogger.getLogger()).
- Orchestra log events in process models write log entries.
Enable Scenario Logging for the Monitor
To enable scenario logging in the monitor, navigate to Settings -> Environment Settings -> Logging and set "scenario.enabled" to "true", as illustrated in the screenshot below:
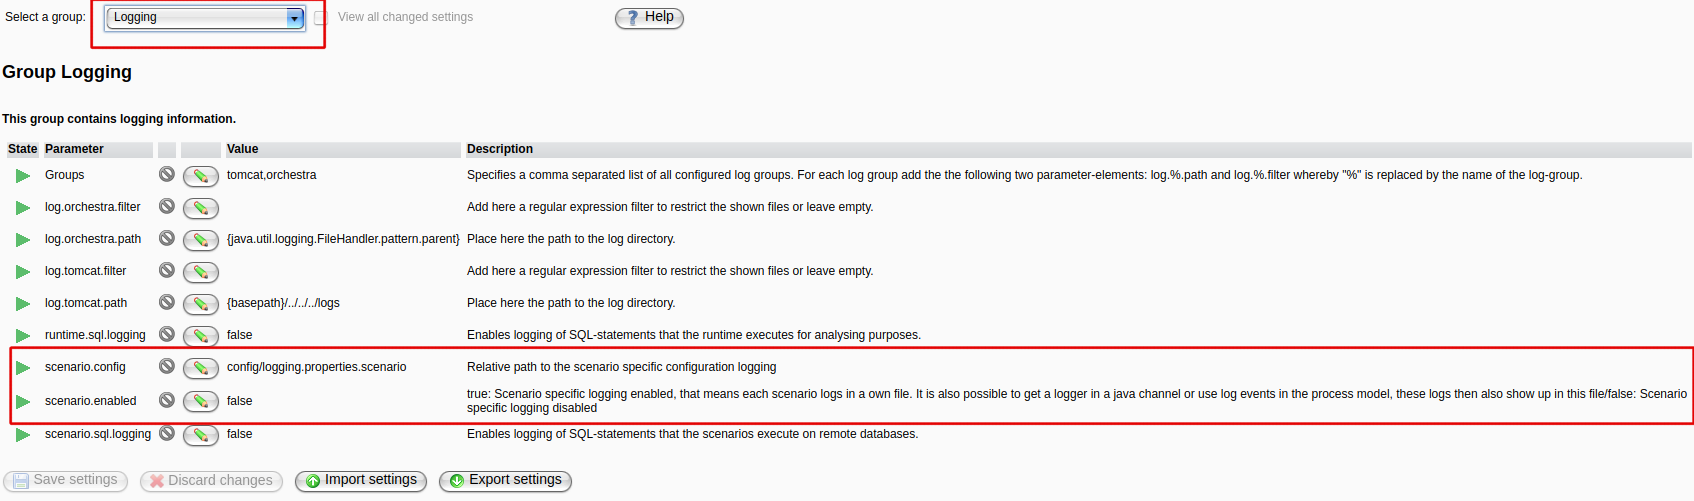
Next, you must adapt the logging.properties.scenario file located in the config directory:
# Instructions for scenario-specific logging
# ==========================================
#
# To enable scenario-specific logging in the designer, set the "scenario.enabled" parameter in the "logging" group
# to "true".
# To enable scenario-specific logging in the monitor, set "scenario.enabled" in
# Settings -> Logging.
#
#
# To define a global default log level for all scenario loggers, set "emds.log.scenario.level".
#
#
# The global scenario log level can be overwritten by defining a scenario-specific log level that applies only
# to the specific scenario. Replace <scenario-id> with the actual scenario identifier and set a log level:
# Examples:
# emds.log.scenario.<scenario-id>.level = INFO
# emds.log.scenario.1e244b72-30f2-42e3-aeba-52154fdecb90.level = FINE
#
# The attribute pattern can use the standard properties of java-util-logging.
# Furthermore, the following parameters are supported by Orchestra:
#   $(SCENARIO.ID)          - Unique identifier of the scenario. This string will be replaced internally by Orchestra.
#   $(SCENARIO_NAME)        - This string will be replaced internally by Orchestra with the name of the scenario.
#   %d                      - Current date in format yyyyMMdd (e.g., 20110718).
#   %s                      - Scenario ID.
emds.log.scenario.level                     = ${orchestra.log.level.scenario}
emds.log.scenario.loggername                = emds.log.scenario.%s
emds.log.scenario.FileHandler.pattern       = /tmp/$(SCENARIO.NAME)_orchestra_%g.mlog
emds.log.scenario.FileHandler.limit         = 250000
emds.log.scenario.FileHandler.count         = 4
emds.log.scenario.FileHandler.formatter     = emds.log.context.LineFormatter
emds.log.scenario.FileHandler.parent        = false
The path defined in the "emds.log.scenario.FileHandler.pattern" parameter indicates where the log file can be found. If set to the same value as the log path in the configuration file ../logging.properties, the scenario log files will be located in the same directory as other log files and can be viewed from inside the Orchestra monitor.
Enable Scenario-specific System Events in the Designer
To write system events to the scenario log, set the "scenario.log.enabled" parameter in the "EventEngine" group of the environment_settings_designer.xml to "true":
<group name="EventEngine">
...
   <parameter name="scenario.log.enabled" value="true" />
</group>
Enable Scenario-specific System Events from Within the Monitor
To enable scenario-specific system events in the monitor, navigate to Settings -> Environment Settings -> Event Engine. The scenario-specific event logging is configured with the parameters shown in the screenshot below:

Process Monitoring and Logging
Orchestra's integrated process monitoring provides users with high-level log information about process execution. This includes the state of active and completed process instances, the sequence of steps and associated process variables for each process, and the assignment of business keys and business events.
All of this information is available in the Orchestra Monitor, which offers filtering, searching, restart, and recovery capabilities.
Monitoring Modes
Orchestra supports two monitoring modes: persistent and volatile.
| Mode | Storage | Use case |
|---|---|---|
PERSISTENT | Runtime database | Full auditability, data survives restarts |
VOLATILE | In-memory cache | Higher throughput, no persistence overhead |
Volatile monitoring improves throughput by reducing the number of persistence operations. Use it when audit durability is not required.
Configuration
The monitoring mode is controlled by the property ProcessMonitoring.repository.type. The following values are
supported:
PERSISTENT? All log data is written to the underlying runtime database.VOLATILE? All log data is kept in main memory only and is not persisted.
Volatile Process Monitoring
With volatile monitoring, all log data is kept in memory. This eliminates database writes entirely, reducing load on the runtime database. The trade-off is durability: if the server crashes, all in-memory log data is lost, and the recorded state may no longer reflect the actual execution state.
Memory Limits
To limit resource usage, the in-memory cache enforces configurable maximums for active processes, completed processes, steps per process, and business events per process. Once a maximum is reached, the oldest entries are evicted automatically. This makes the cache inconsistent ? the logged state no longer reflects actual execution ? until resource pressure subsides and the cache recovers automatically.
Volatile monitoring does not survive server restarts. Any log data held in memory is lost when the process engine stops.
File-Based Logging
If a durable record of all process activity is required, you can enable file-based logging. This writes all log data to a multi-line JSON file independently of the selected monitoring mode.
Configuration
The behavior is configured under Settings > Process Monitoring.
| Property | Description |
|---|---|
repository.volatile.cache.active.size | Maximum number of active process instances kept in the log cache. |
repository.volatile.cache.completed.size | Maximum number of completed process instances kept in the log cache. |
repository.volatile.token.size | Maximum number of process steps stored per process instance. |
repository.volatile.businessevent.size | Maximum number of business events stored per process instance. |
Persistent Process Monitoring
Process state information captures the basic lifecycle of each process instance. When a process instance starts, Orchestra writes the start date and metadata ? such as the owning process model ? to the database. When the process ends, the end date and final state are recorded as well.
Synchronous vs. Asynchronous Logging
By default, process state is written synchronously, ensuring the recorded state is always consistent with actual execution. This requires at least three additional SQL statements per process instance, which is acceptable for long-running processes.
For short-lived processes, synchronous logging can noticeably increase overall process duration. In these cases, * asynchronous logging* can be enabled. With asynchronous logging, state changes are captured in memory first. Consecutive changes to the same record are merged in a table cache, and after a configurable delay the cache is flushed to the database in a single batch ? significantly reducing write overhead.
The following image illustrates how asynchronous statement execution works:
When the process engine writes a statement, it is sent to the table cache, which holds the current state of all pending database records. Changes affecting the same row are merged, so only the final state needs to be persisted. After a configurable interval, all rows are evicted from the cache and written to the database in a batch, improving throughput.
Throughput can be further tuned with the congestion factor, which controls the delay between a record being created and being written to the database. A higher value increases the batch size and throughput but introduces more latency before records appear in the monitor. A lower value reduces that latency.
To protect against data loss on server crash, journaling can be enabled. When active, all SQL statements are written to a journal file. On startup, Orchestra replays any pending operations from the journal. Journaling is disabled if no journal directory is configured.
After a server crash, the database state may be out of sync with the table cache, causing the monitor to show processes as running that have already been aborted. In this situation, manual intervention is required to abort those processes and rebuild the process overview.
Configuration
The behavior is configured under Settings > Process Monitoring.
Asynchronous State Logging
| Property | Description |
|---|---|
log.async.mode.volatile | Async logging level for volatile processes. DISABLED ? synchronous, fully consistent. LEVEL1 ? business keys/events written asynchronously (no inconsistencies, but data may be lost on crash). LEVEL2 ? process start written synchronously; inconsistencies possible in aborted/warning/completed counts. LEVEL3 ? fully asynchronous; inconsistencies possible in created/aborted/warning/completed counts. |
log.async.mode.persistent | Async logging level for persistent processes. DISABLED ? synchronous, fully consistent. LEVEL1 ? business keys/events written asynchronously. LEVEL2 ? process start written synchronously; inconsistencies possible in aborted/warning/completed counts. |
log.async.congestion.control | Maximum number of database operations held in the write queue. A higher value increases throughput but delays visibility in the monitor; a lower value reduces the delay. |
log.async.mode.flushAfter | Interval (in seconds) at which the cache is flushed to the database when async logging is active. |
log.async.max.rows | Maximum number of rows held in the cache before a flush is triggered. |
log.async.error.retries | Number of retry attempts for failed database write operations. |
log.async.error.waittime | Wait time (in seconds) between retry attempts after a write error. |
log.async.path | Path to the journal directory. When set, all SQL operations are journaled and replayed on startup after a crash. If not set, journaling is disabled. |
Process Step Logging
Each process instance logs the full trace of executed activities. By default this is written synchronously; for short-lived processes, enabling asynchronous writing reduces performance impact.
| Property | Description |
|---|---|
repository.persistent.threads | Number of threads used to write the process log. 0 ? written synchronously during execution. Any positive value enables asynchronous writing. |
repository.persistent.queue.time | Maximum time (in ms) log entries are held in the cache before being flushed. |
repository.persistent.threshold | Number of log entries accumulated before a flush is triggered. |
repository.persistent.backlog | Maximum number of pending writes. If reached, async logging is temporarily disabled and entries are written directly until the queue drains. |
repository.persistent.max.size | Maximum number of process tokens retained in the log. Older entries are removed once the limit is exceeded. |
General Settings
The following settings apply to both volatile and persistent monitoring modes.
Log Granularity
| Property | Description |
|---|---|
process.log.mode | Controls what is logged: FULL ? all process activity. ERROR ? errors only. OFF ? nothing is recorded. |
process.log.business.keys | Enables (true) or disables (false) business key logging. |
process.log.business.event | Enables (true) or disables (false) business event logging. Recommended: false, as this data is rarely needed. |
process.log.cache | Size of the ring buffer used to cache recent log entries. When process.log.mode is ERROR, Orchestra writes erroneous activities along with all buffered entries to preserve execution history for diagnosis. |
Optimizing Monitor Performance
With large volumes of process data, monitor queries can impact Orchestra's performance. The following settings help control this.
| Property | Description |
|---|---|
process.log.skip.limit | Maximum number of process steps returned for a running process instance. -1 disables the limit. |
process.log.skip.after | Number of log entries read from the beginning before subsequent records are skipped. |
process.log.useCount | If true, the process detail view fetches the total record count. Set to false to reduce database operations when displaying details. |