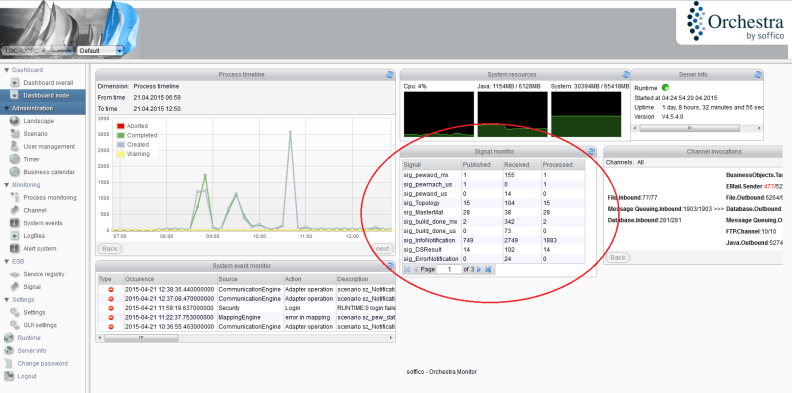
Dashboard
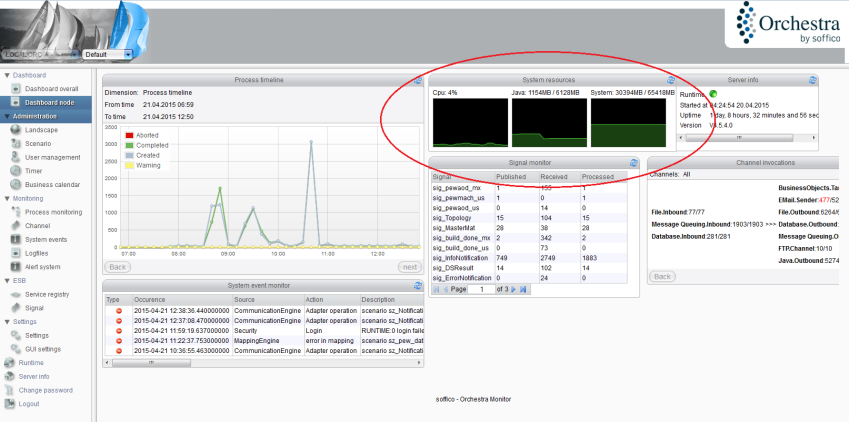
The dashboard aggregates essential information regarding current scenarios and the server itself. It provides an at-a-glance view of the following metrics:
- Full System Capacity
- CPU Usage
- General Memory Usage
- Memory Usage by the Java Runtime Environment
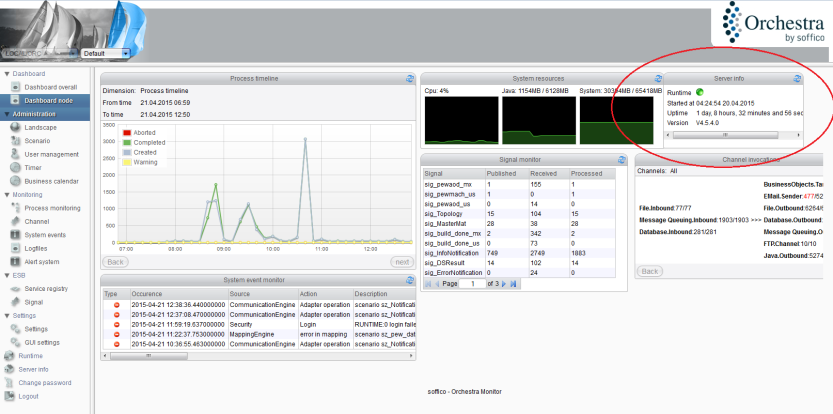
Additionally, the dashboard displays:
- Start Time
- Operation Time
- Orchestra Version
For an overall view of the calls to or from external systems, refer to the "Channel Invocations" info box. You will be informed about:
- The Quantity of Usage
- The Number of Successful Calls
- The Number of Failed Calls
You can also monitor your signal communication at a glance: