Scenario & Process Logging
You can change the log level via Orchestra Monitor inside Settings > Log Level. This change takes effect immediately.
Alternatively, you can modify the log level by editing the file located at /orchestra/WEB-INF/classes/logging.properties. Please note that a restart is necessary for changes made in this file to take effect.
Scenario Monitoring & Logging
It is possible to activate scenario-specific logging for Orchestra. Scenario-specific logging can be viewed as logging application data, although not all entries from the standard log will be automatically written to separate log files.
The logging entries in the scenario log can be created in the following ways:
- Scenario-specific system events can be additionally written to the scenario log.
- The programmer can write log entries using the standard Java logging mechanism (EmdsLogger.getLogger()).
- Orchestra log events in process models write log entries.
Enable Scenario Logging for the Monitor
To enable scenario logging in the monitor, navigate to Settings -> Environment Settings -> Logging and set "scenario.enabled" to "true", as illustrated in the screenshot below:
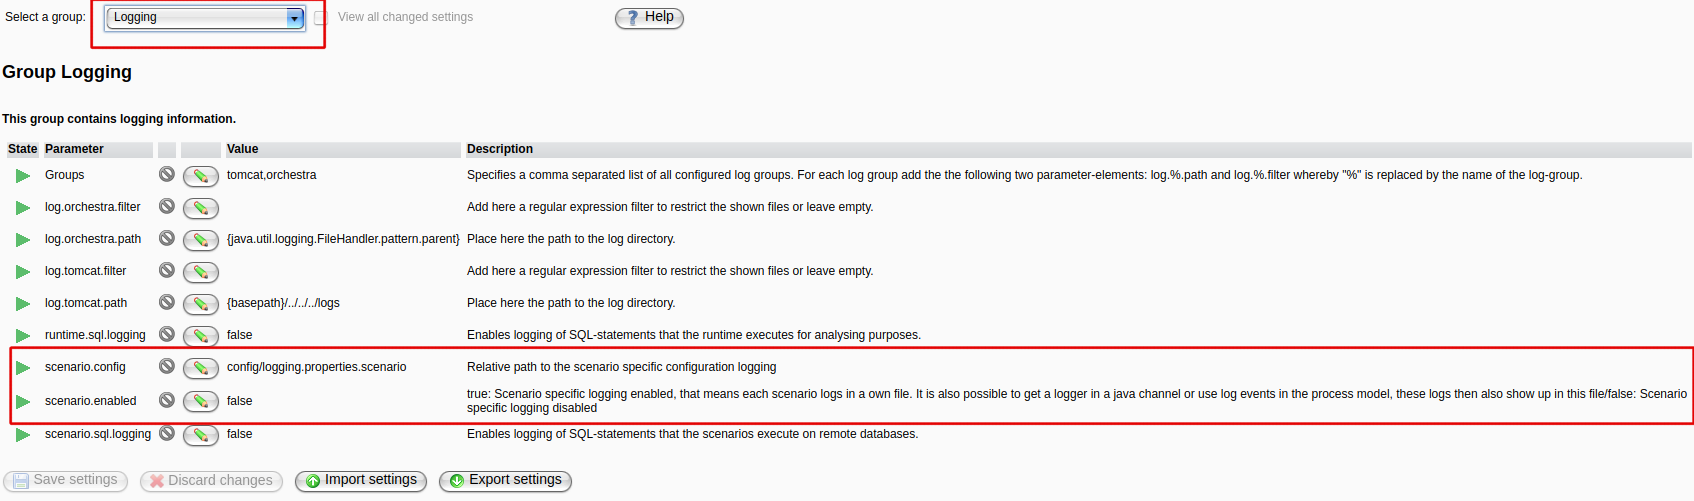
Next, you must adapt the logging.properties.scenario file located in the config directory:
# Instructions for scenario-specific logging
# ==========================================
#
# To enable scenario-specific logging in the designer, set the "scenario.enabled" parameter in the "logging" group
# to "true".
# To enable scenario-specific logging in the monitor, set "scenario.enabled" in
# Settings -> Logging.
#
#
# To define a global default log level for all scenario loggers, set "emds.log.scenario.level".
#
#
# The global scenario log level can be overwritten by defining a scenario-specific log level that applies only
# to the specific scenario. Replace <scenario-id> with the actual scenario identifier and set a log level:
# Examples:
# emds.log.scenario.<scenario-id>.level = INFO
# emds.log.scenario.1e244b72-30f2-42e3-aeba-52154fdecb90.level = FINE
#
# The attribute pattern can use the standard properties of java-util-logging.
# Furthermore, the following parameters are supported by Orchestra:
#   $(SCENARIO.ID)          - Unique identifier of the scenario. This string will be replaced internally by Orchestra.
#   $(SCENARIO_NAME)        - This string will be replaced internally by Orchestra with the name of the scenario.
#   %d                      - Current date in format yyyyMMdd (e.g., 20110718).
#   %s                      - Scenario ID.
emds.log.scenario.level                     = ${orchestra.log.level.scenario}
emds.log.scenario.loggername                = emds.log.scenario.%s
emds.log.scenario.FileHandler.pattern       = /tmp/$(SCENARIO.NAME)_orchestra_%g.mlog
emds.log.scenario.FileHandler.limit         = 250000
emds.log.scenario.FileHandler.count         = 4
emds.log.scenario.FileHandler.formatter     = emds.log.context.LineFormatter
emds.log.scenario.FileHandler.parent        = false
The path defined in the "emds.log.scenario.FileHandler.pattern" parameter indicates where the log file can be found. If set to the same value as the log path in the configuration file ../logging.properties, the scenario log files will be located in the same directory as other log files and can be viewed from inside the Orchestra monitor.
Enable Scenario-specific System Events in the Designer
To write system events to the scenario log, set the "scenario.log.enabled" parameter in the "EventEngine" group of the environment_settings_designer.xml to "true":
<group name="EventEngine">
...
   <parameter name="scenario.log.enabled" value="true" />
</group>
Enable Scenario-specific System Events from Within the Monitor
To enable scenario-specific system events in the monitor, navigate to Settings -> Environment Settings -> Event Engine. The scenario-specific event logging is configured with the parameters shown in the screenshot below:

Process Monitoring and Logging
The integrated process monitoring of Orchestra writes all process-related information to the integrated Orchestra runtime database. In systems with high throughput, process monitoring can become a bottleneck, as it imposes additional load on the underlying database. To reduce this load, the method for writing log information can be switched between synchronous and asynchronous logging.
The Process State Information
The process state information is used to monitor the basic lifecycle of each process instance. When a process instance is started, the start date and additional information, such as the owning process model, are written to the database. When the process ends, the end date and end state are also recorded.
In the default setup, the process state is written synchronously to the database, ensuring that the state information is consistent with the actual process state. However, this mode requires at least three additional SQL statements for every process instance, which is acceptable for long-running processes.
For processes with short durations, synchronous logging can significantly impact overall process duration. To mitigate this, asynchronous state logging can be enabled. This captures all process state information in memory, merging consecutive state changes into the existing cache state. After a configurable delay, the cache is flushed and written to the database, significantly reducing logging overhead and enabling optimized batch processing.
The following image illustrates how asynchronous statement execution works:
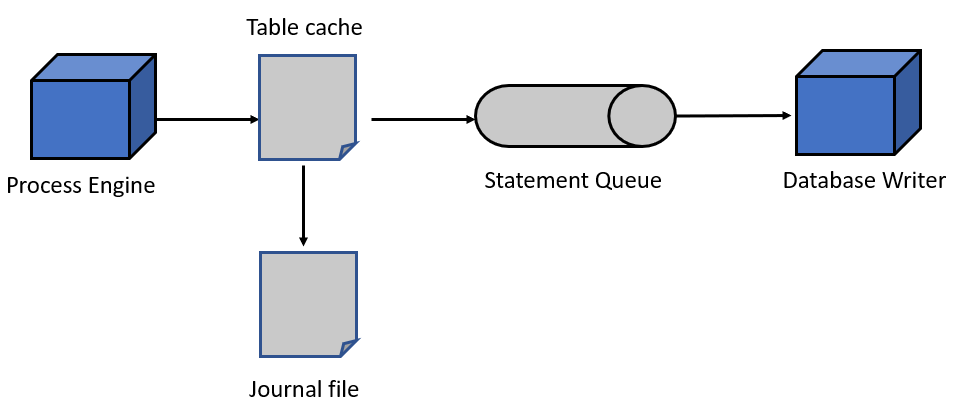
When the Process Engine writes a statement to the database, the statement is sent to the table cache, which holds the current state of all database records. This cache is particularly useful for short-running processes, as all statements affecting the same row are collected, allowing for an overall state to be computed by merging the changes into that row. After a configurable time, all rows are evicted from the table cache and sent to the database flusher, which writes all records to the database. This improves execution speed due to batch processing of SQL statements.
The statement execution pipeline's behavior can be controlled by a congestion factor. This factor defines the delay between a record's creation and its writing to the database. A larger value may lead to a greater delay between process execution and data writing, while a smaller value decreases the delay. The congestion factor is especially important in high-throughput systems, where it may slow execution if more records require writing than the congestion control allows.
To prevent inconsistencies in the event of a server crash, journaling can be activated. This feature writes all SQL statements to a journal file, which is processed on server startup, allowing pending write operations to be re-executed. If no journal directory is set, this feature remains disabled.
For volatile and persistent processes, different settings exist that control how state information is logged depending on the quality of service for a process.
Inconsistencies in process information may occur after a server crash, as the database state could become unsynced with the table cache. This may result in the monitoring interface displaying running processes that have already been aborted. In such situations, manual intervention is required to abort the processes and rebuild the process overview.
The behavior can be configured under Settings > Process Engine
| Name | Description |
|---|---|
| log.async.mode.volatile | Defines the default behavior for writing process state information of volatile processes. If LEVEL2 or LEVEL3 is set, inconsistencies may arise. DISABLED - All process state information is written immediately (no inconsistencies). LEVEL1 - Only business keys and business events are written asynchronously (no inconsistencies, but business key information may be lost). LEVEL2 - Process start is written synchronously (inconsistencies in the number of aborted/warning/completed processes). LEVEL3 - Full asynchronous database access (inconsistencies in the number of created/aborted/warning/completed processes). |
| log.async.mode.persistent | Defines the default behavior for writing process state information of persistent processes. If LEVEL2 is set, inconsistencies may arise. DISABLED - All process state information is written immediately (no inconsistencies). LEVEL1 - Only business keys and business events are written asynchronously (no inconsistencies, but business key information may be lost). LEVEL2 - Process start is written synchronously (inconsistencies in the number of aborted/warning/completed processes). |
| log.async.congestion.control | Defines the maximum number of database operations that may be kept in the write queue. If the limit is exceeded, congestion control automatically slows down the system. A larger value increases throughput but introduces a delay before records are visible in the process overview. A smaller value reduces visibility delay. |
| log.async.mode.flushAfter | If asynchronous logging is active, this parameter defines how often log data is written to the database (in seconds). |
| log.async.max.rows | When asynchronous logging is active, this parameter defines how many rows are stored in the cache before they are flushed to the database. |
| log.async.error.retries | When asynchronous logging is active, this parameter defines how often Orchestra attempts to write erroneous records to the database. |
| log.async.error.waittime | If asynchronous logging is active, this parameter defines the wait time (in seconds) between two database operations in case of an error. |
| log.async.path | If asynchronous logging is active, this parameter defines the path to the journal directory. All SQL operations are written to this directory. In case of a server crash, the log file is read and all operations are re-executed to prevent inconsistencies. If no directory is specified, journaling is disabled. |
The Process Log Information
Each process instance logs the trace of all executed activities to the database. By default, this information is written synchronously. For short-running processes, synchronous logging can lead to performance degradation due to time-consuming write operations. To address this issue, asynchronous logging can be enabled.
| Name | Description |
|---|---|
| process.process.log.threads | The number of threads used to write the process log to the database. A value of 0 means log information is written during process execution. A positive value enables asynchronous writing. |
| process.process.log.time | The maximum time log entries are cached before being written to the database. If the log entries exceed this time, they are automatically written. |
| process.log.threshold | The number of log entries collected before they are written to the database. |
| process.log.backlog | The maximum number of pending database writes. If this limit is reached, asynchronous logging is disabled, and entries are written directly to the database until the queue is processed. |
| log.max.size | The maximum number of process tokens retained in the process log. If this limit is exceeded, older values are removed from the log. |
Another approach for reducing overhead is to disable process log information altogether.
| Name | Description |
|---|---|
| process.log.mode | Defines whether the entire process log (FULL) or only errors (ERROR) are written to the database. If OFF is set, no information is recorded. |
| process.log.business.keys | Determines if the processing of business keys is enabled (true) or disabled (false). |
| process.log.business.event | Determines if the processing of business events is enabled (true) or disabled (false). It is recommended to set this to false, as the information is rarely used. |
| process.log.cache | Defines the size of the ring buffer used to cache process log entries. When the process mode is set to ERROR, Orchestra writes erroneous process activities and all entries from the ring buffer to aid diagnosis, preserving execution history. |
Optimizing Monitor Access
In situations with extensive process information, monitor access can negatively impact Orchestra's performance. The following settings can influence this behavior.
| Name | Description |
|---|---|
| process.log.skip.limit | The maximum number of process steps displayed for a running process instance. A value of -1 disables this limit; otherwise, only the specified number will be returned. |
| process.log.skip.after | The number of process logs to be read from the beginning before further records are skipped. |
| process.log.useCount | Determines if the process detail list should display the maximum number of records (=true) or not (=false). Setting this to false reduces database operations when showing details. |